Is your recruitment process letting you down? How to use data to optimise your recruitment.
Having the best people is vital to any company. However, hiring the best staff is difficult — you can’t know if your hiring decisions are right until several months (sometimes years) after the hire has been made.
Is your recruitment process letting you down by causing you to make the wrong hiring decisions? How can you design your recruitment to maximise the likelihood that you make the right decisions?
The answer, as often, lies hidden in the data.
Is a data-driven approach to recruitment possible?
Deciding which applicant has the highest potential for future career success is not an easy task.
Today, many hiring decisions are based on haphazard gut feelings. More structured approaches are often nothing more than ticking a few boxes. In contrast, Marketing, Finance, and Insurance practices have long relied on data analytics to help inform their decisions.
So what would such a data-driven approach look like in recruitment?
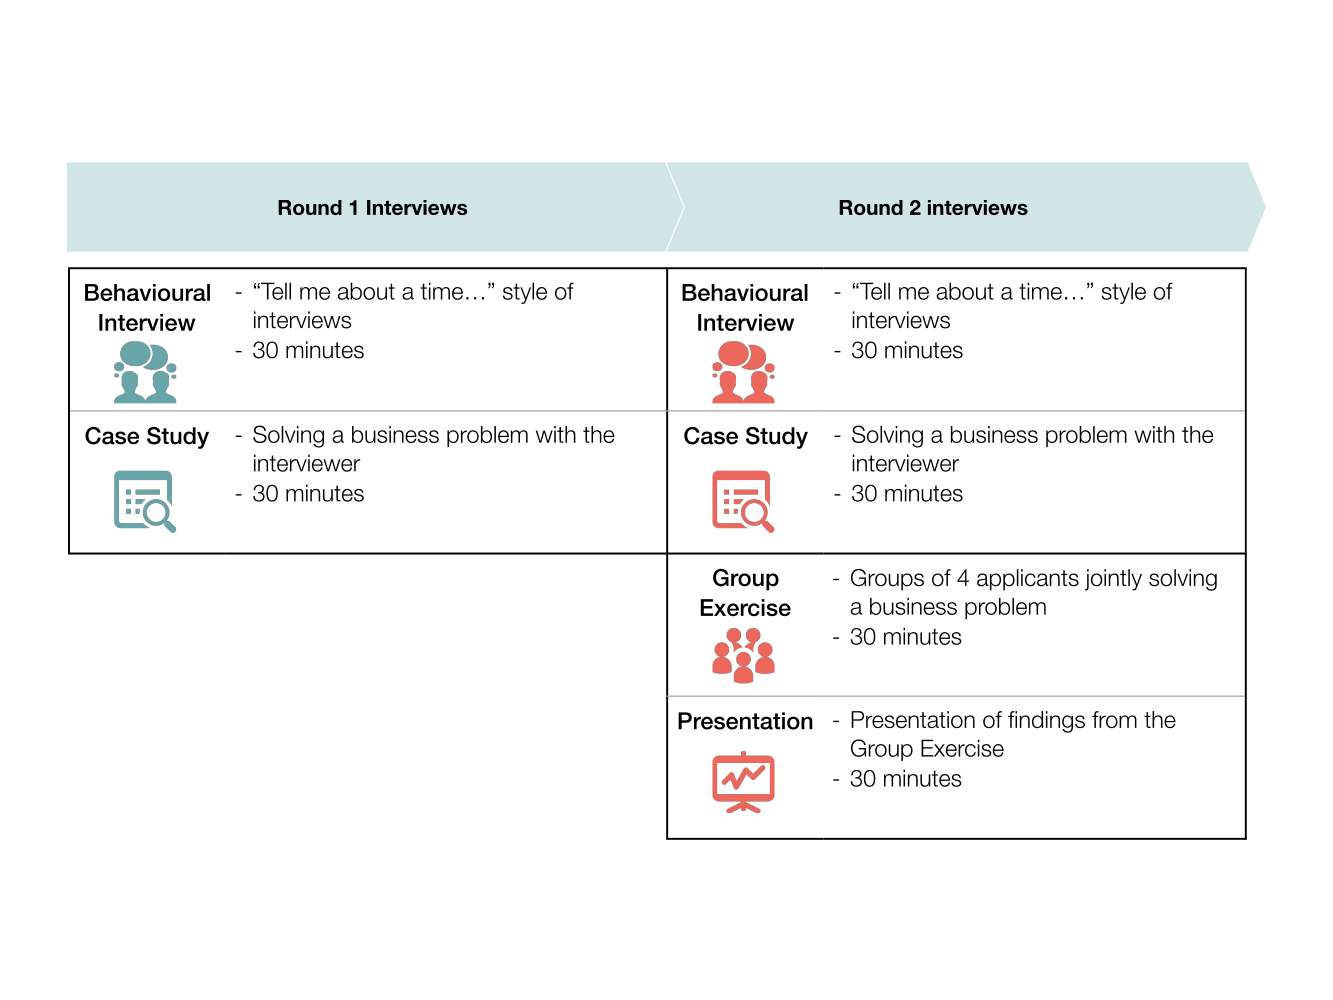
To answer this question, let’s explore the recruitment practice of a UK-based company hiring MBA graduates. Their recruitment consists of 2 rounds of interviews.
Round 1 is conducted on campus and consists of a 30-minute behavioural interview followed by a 30-minute case interview. Successful candidates are then invited to the UK for a Round 2 Assessment Day which consists of a behavioural interview, a case interview, a group exercise, and a presentation. All six interviews across the two rounds carry the same weight.
At the end of the Round 2 Assessment Day, interviewers come together to recap their interviews and jointly decide which candidates get offers and which get turned down.
Figure 1: Recruitment process of an example company
Understanding what is currently happening - intentionally and unintentionally
Let us start by understanding how recruitment decisions are made. The question we want to answer is “How likely will a candidate get an offer, given the outcomes of her interviews?” We do this by calculating the likelihood of getting an offer, given strong interview results, and the likelihood of not getting an offer, given weak interview results. For simplicity, in Figure 2 we show the results of this analysis by ranking the predictive strengths.
Figure 2: Relative predictive strength of each interview
| Stage | Assessment | Rank of predictive strength for who gets an offer |
|---|---|---|
| Round 1 Interviews | General Interview | 5th |
| Case Interview | 4th | |
| Round 2 Interviews | General Interview | 3rd |
| Case Interview | 6th | |
| Group Interview | 1st | |
| Presentation | 2nd |
Here, we see that the group interview is the strongest predictor of getting an offer. In other words, candidates who did well in their group interview tend to get an offer, while those who did not do well tend to be turned down.
This insight is powerful because we can know the likely outcome of the Assessment Day BEFORE the interviewers come together to jointly make the decision. Additionally, since the recruitment process did not intentionally overweigh the group interview, the interviewers must have been instinctively placing greater emphasis, and hence basing their decisions, on it.
But are their instincts correct?
What should be happening
If we want to optimise the likelihood of hiring decisions leading to great employees, then our prediction analysis should focus on candidates who become successful employees, rather than those who simply get an offer.
In this example, “successful hires” meant those employees who are performing at or above expectations 24 months after their initial start date. With some performance data, we can re-run this analysis to predict performance. Figure 3 shows the results.
Figure 3: Predictive strength of each interview on candidates likely to perform
| Stage | Assessment | Rank of predictive strength for who gets an offer | Rank of predictive strength for who will be a high performer |
|---|---|---|---|
| Round 1 Interviews | General Interview | 5th | 2nd |
| Case Interview | 4th | 1st | |
| Round 2 Interviews | General Interview | 3rd | 6th |
| Case Interview | 6th | 3rd | |
| Group Interview | 1st | 5th | |
| Presentation | 2nd | 4th |
Two interesting observations:
-
The group exercise that interviewers were instinctively basing their hiring decisions on is not such a strong predictor of success, and
-
The case interview and the behavioural interview is run twice - once in round 1 and again in round 2, but the second time is much worse at predicting success.
The favourite ‘Group Interview’
When discussing the results of this analysis, one interviewer told us, “We don’t purposely over-weigh the group exercise, but I do admit it’s my favourite interview. It’s the only time I get to see candidates side-by-side, working together.”
This may be the interviewer’s favourite interview, but it is not the most effective in predicting success.
Notably, depending on how the group interview is designed, it can favour extraversion or introversion, so it’s worth being aware where your individual biases lie.
Same interviews, different results
What about the two behavioural and case interviews? One difference between Round 1 and Round 2 interviews is the interviewers themselves. Round 1 interviews were conducted by a dedicated recruitment team who interview all candidates year on year. Round 2 interviews by contrast were conducted by interviewers who were available on the day. “Last minute cancellations are not uncommon leaving recruitment coordinators scrambling to find replacements”, said the department head. This lack of consistency affects the quality of the interviews, and hence, affects the accuracy of hiring decisions.
Designing a more effective recruitment model
Armed with these facts, this company set out to redesign its recruitment model. Here are three of the changes they made:
-
Drop the second-round case interview — The case interview in Round 2 had a much lower predictive value than the same interview in Round 1, and hence was unnecessary. This improved the overall success rate of recruitment and reduced the resources required (Round 2 interviews are conducted by senior staff members, who are scarce).
-
Change the second behavioural interview — The second behavioural interview was identical to the first, but didn’t need to be. The company decided to use this as a non-evaluative interview where they can test new techniques. They will perform similar analysis in the near future to measure their effectiveness.
-
Redesign the group exercise — While the group exercise in its current form offered little predictive value, the company still believed there was potential. And so they reverse engineered the group exercise to focus on traits that were more predictive of future performance. The intended benefit of this change wasn’t just to increase the value of the interview, but also to give the candidates a more realistic experience of what it’s like to be an employee. For this experience to be an accurate indication of the work itself, a high predictability score is required.
Analytics are vital, not a luxury
This example illustrates how data analytics can surface flaws that have been hindering a company’s performance for years. It uncovers hidden biases and provides confidence for change.
The analysis described here was relatively simple, requiring only techniques familiar to every math and statistics student. But the value to the business is tremendous — the Head of the department said “A handful of high performers make or break my business — having more is our competitive edge.”
Using data to inform business decisions has long been prevalent in many functions. These functions regard data as sacred, going to great lengths to collect and analyse it.
The recruitment function should be no different.
The Takeaway
Irrational biases can lurk anywhere in your people processes.
1. Pick an area where you’re not satisfied with the results or identify commonly held beliefs that you feel are detrimental. This could be recruitment, promotions, retention, referrals, performance, employee satisfaction surveys - no HR or Recruitment topic is safe.
2. Precisely map the decision-making process that leads to those results.
3. Work with a statistician to translate facts into data and run regressions to uncover which process step is faulty. If you don’t have enough people-power in-house to perform this kind of analysis, we at Pirical can help.
If you would like to get started with this analysis in your firm, get in touch — it’s what we do best.
Subscribe to the latest data insights & blog updates
Fresh, original content for Law Firms and Legal Recruiters interested in data, diversity & inclusion, legal market insights, recruitment, and legal practice management.